
“Is gold trending?” has no single empirical answer. A trend is always measured over a horizon, and changing that horizon changes both the information captured and the noise admitted.
The three horizon signs disagreed on 53.1% of sampled days.
Nearby rules add robustness only when their dependence is understood.
A deliberately simple measurement
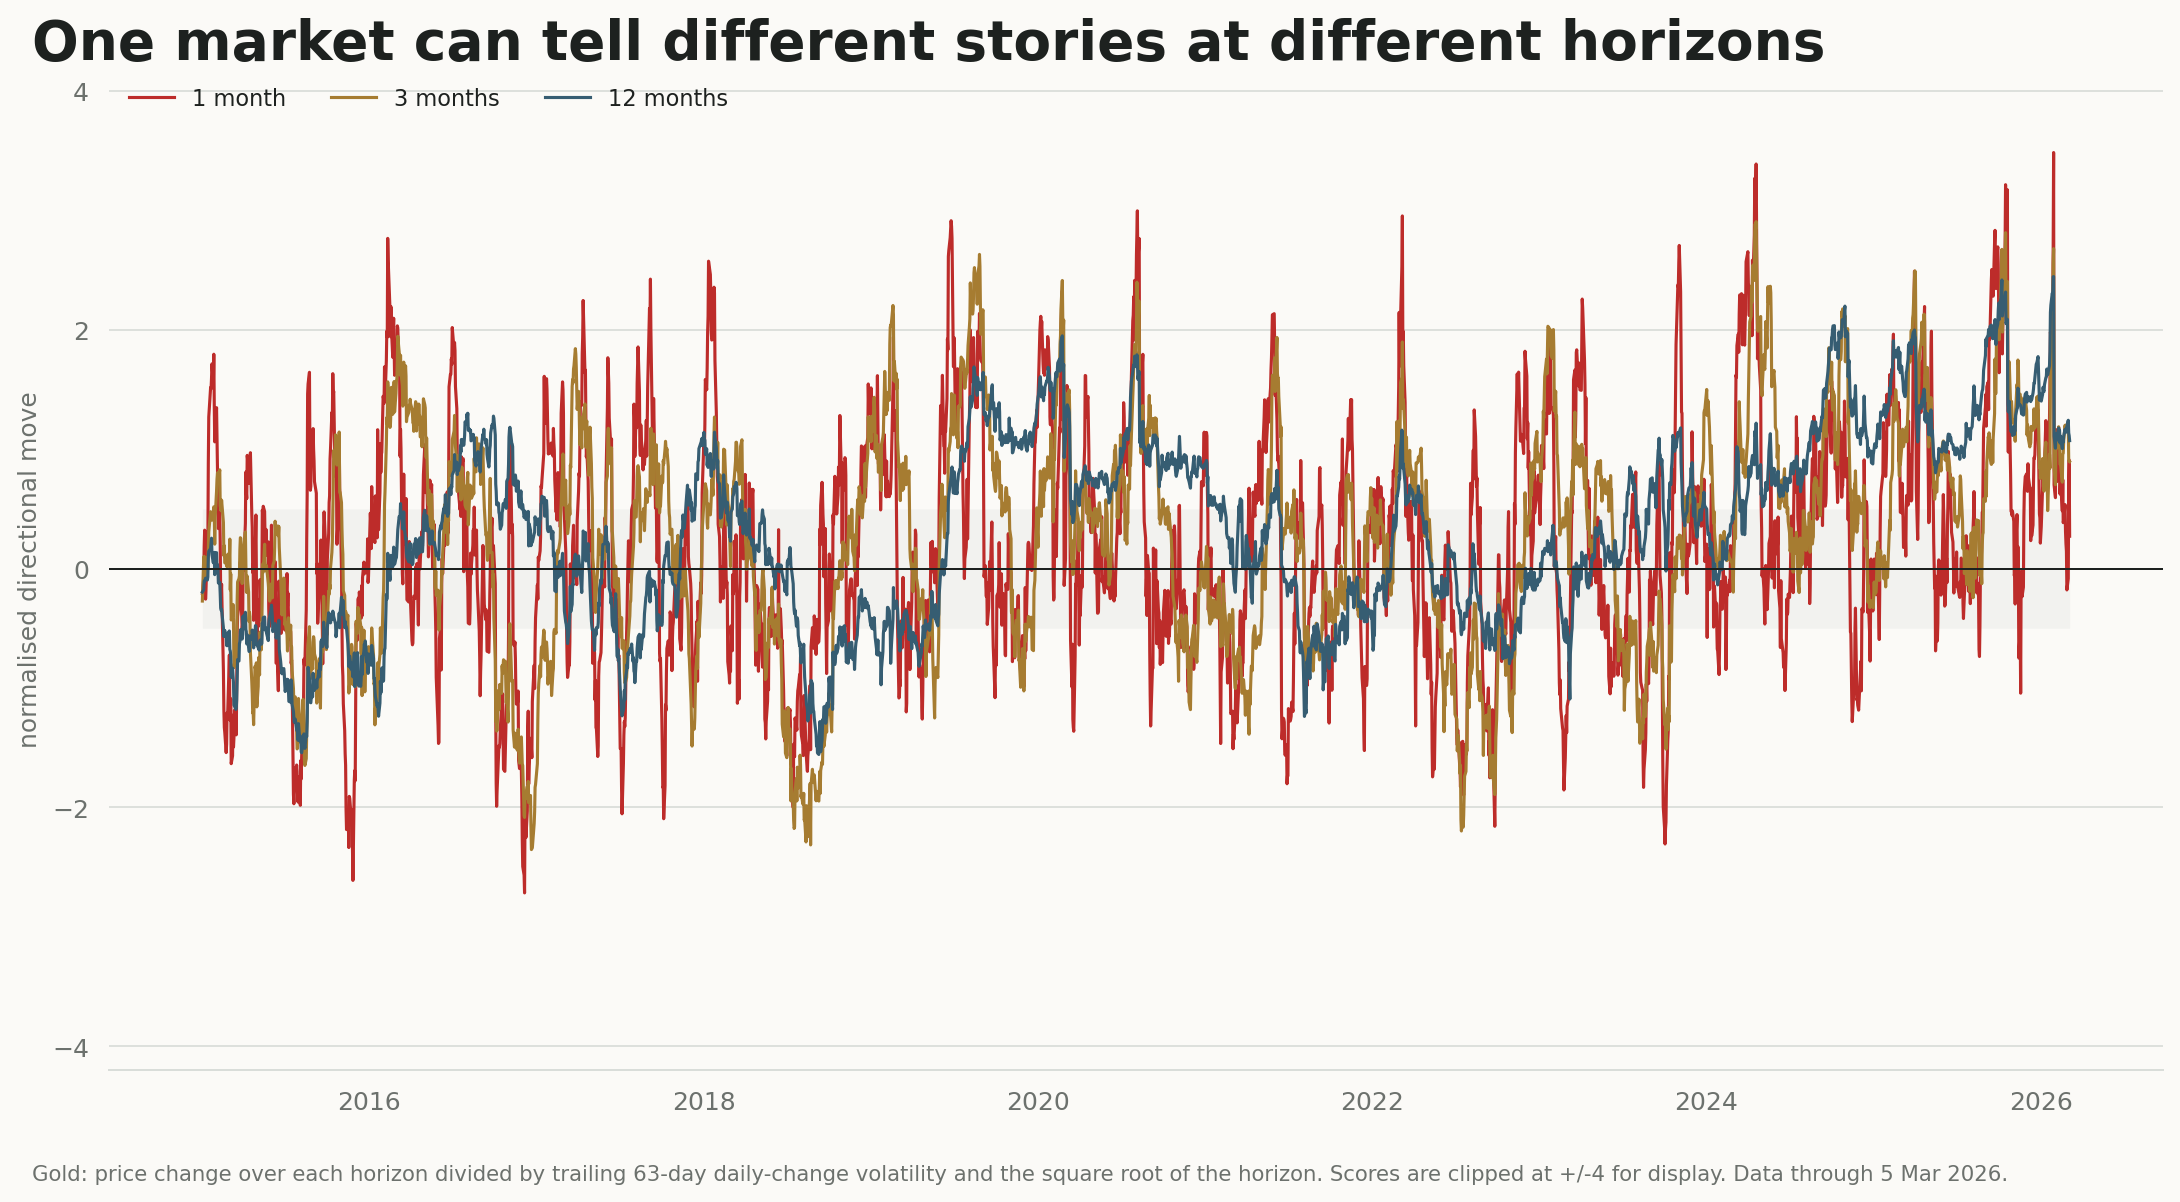
For each day, we subtract the price 21, 63, or 252 trading days earlier. The difference is divided by the trailing 63-day standard deviation of daily price changes and by the square root of the horizon. This produces three roughly comparable measures of directional movement.
The calculation is intentionally not a trading rule. It has no smoothing, buffer, transaction-cost model, position sizing, or portfolio overlay. Its purpose is to isolate what the choice of horizon does before those later decisions are introduced.
Agreement is episodic
Long, persistent moves pull the horizons into alignment. Reversals split them apart: the one-month measure changes first, while the twelve-month measure still reflects the older move. Sideways periods produce a different disagreement, with shorter measures crossing zero repeatedly around a slower signal.
At the end of this sample, all three measures were positive, but not equally so: 0.27 at one month, 0.89 at three months, and 1.07 at twelve months. The market had positive long-horizon direction with much less short-horizon extension. That description is more informative than collapsing the three observations into a single label.
| Horizon | End-of-sample score | What it emphasises |
|---|---|---|
| 21 trading days | 0.27 | Recent turns; highest responsiveness |
| 63 trading days | 0.89 | Intermediate move; less reversal noise |
| 252 trading days | 1.07 | Persistent direction; slowest adaptation |
Several horizons are not several independent signals
Adding the three lines together may reduce sensitivity to any one parameter, but it does not create three unrelated sources of return. The measures share the same market, much of the same history, and the same economic intuition. Treating them as independent votes would overstate confidence.
A better implementation preserves the family relationship. Nearby horizons can be grouped, forecast weights can reflect their correlation, and turnover can be controlled at the combined position rather than independently for every rule. This was the practical motivation for making rule groups and instrument hierarchies explicit in the research system.
Parameter diversification is useful when it reduces fragility. It is dangerous when repeated versions of one idea are counted as independent evidence.
Why the fastest line should not automatically win
A short horizon responds earlier to a new move, but it also trades more often and reacts more strongly to temporary reversals. A long horizon is more stable, but it carries stale information after a regime change. The choice is a joint question about evidence, costs, liquidity, and portfolio interaction—not a search for the historically best-looking line.
Robust research therefore asks whether a conclusion survives reasonable neighbouring horizons, then accounts for the extra turnover and correlation created by combining them. The goal is not to find one perfect lookback. It is to avoid making the portfolio depend on an arbitrary one.
Limits of this note
Gold is one market and 2015–2026 is one period. The normalisation uses a single volatility estimate, ignores costs, and does not test forecast efficacy. Sign disagreement is descriptive; it is not proof that combining horizons improves returns. A portfolio-level conclusion would require a much broader cross-market study with realistic implementation.