
NOTE 03
Portfolio construction
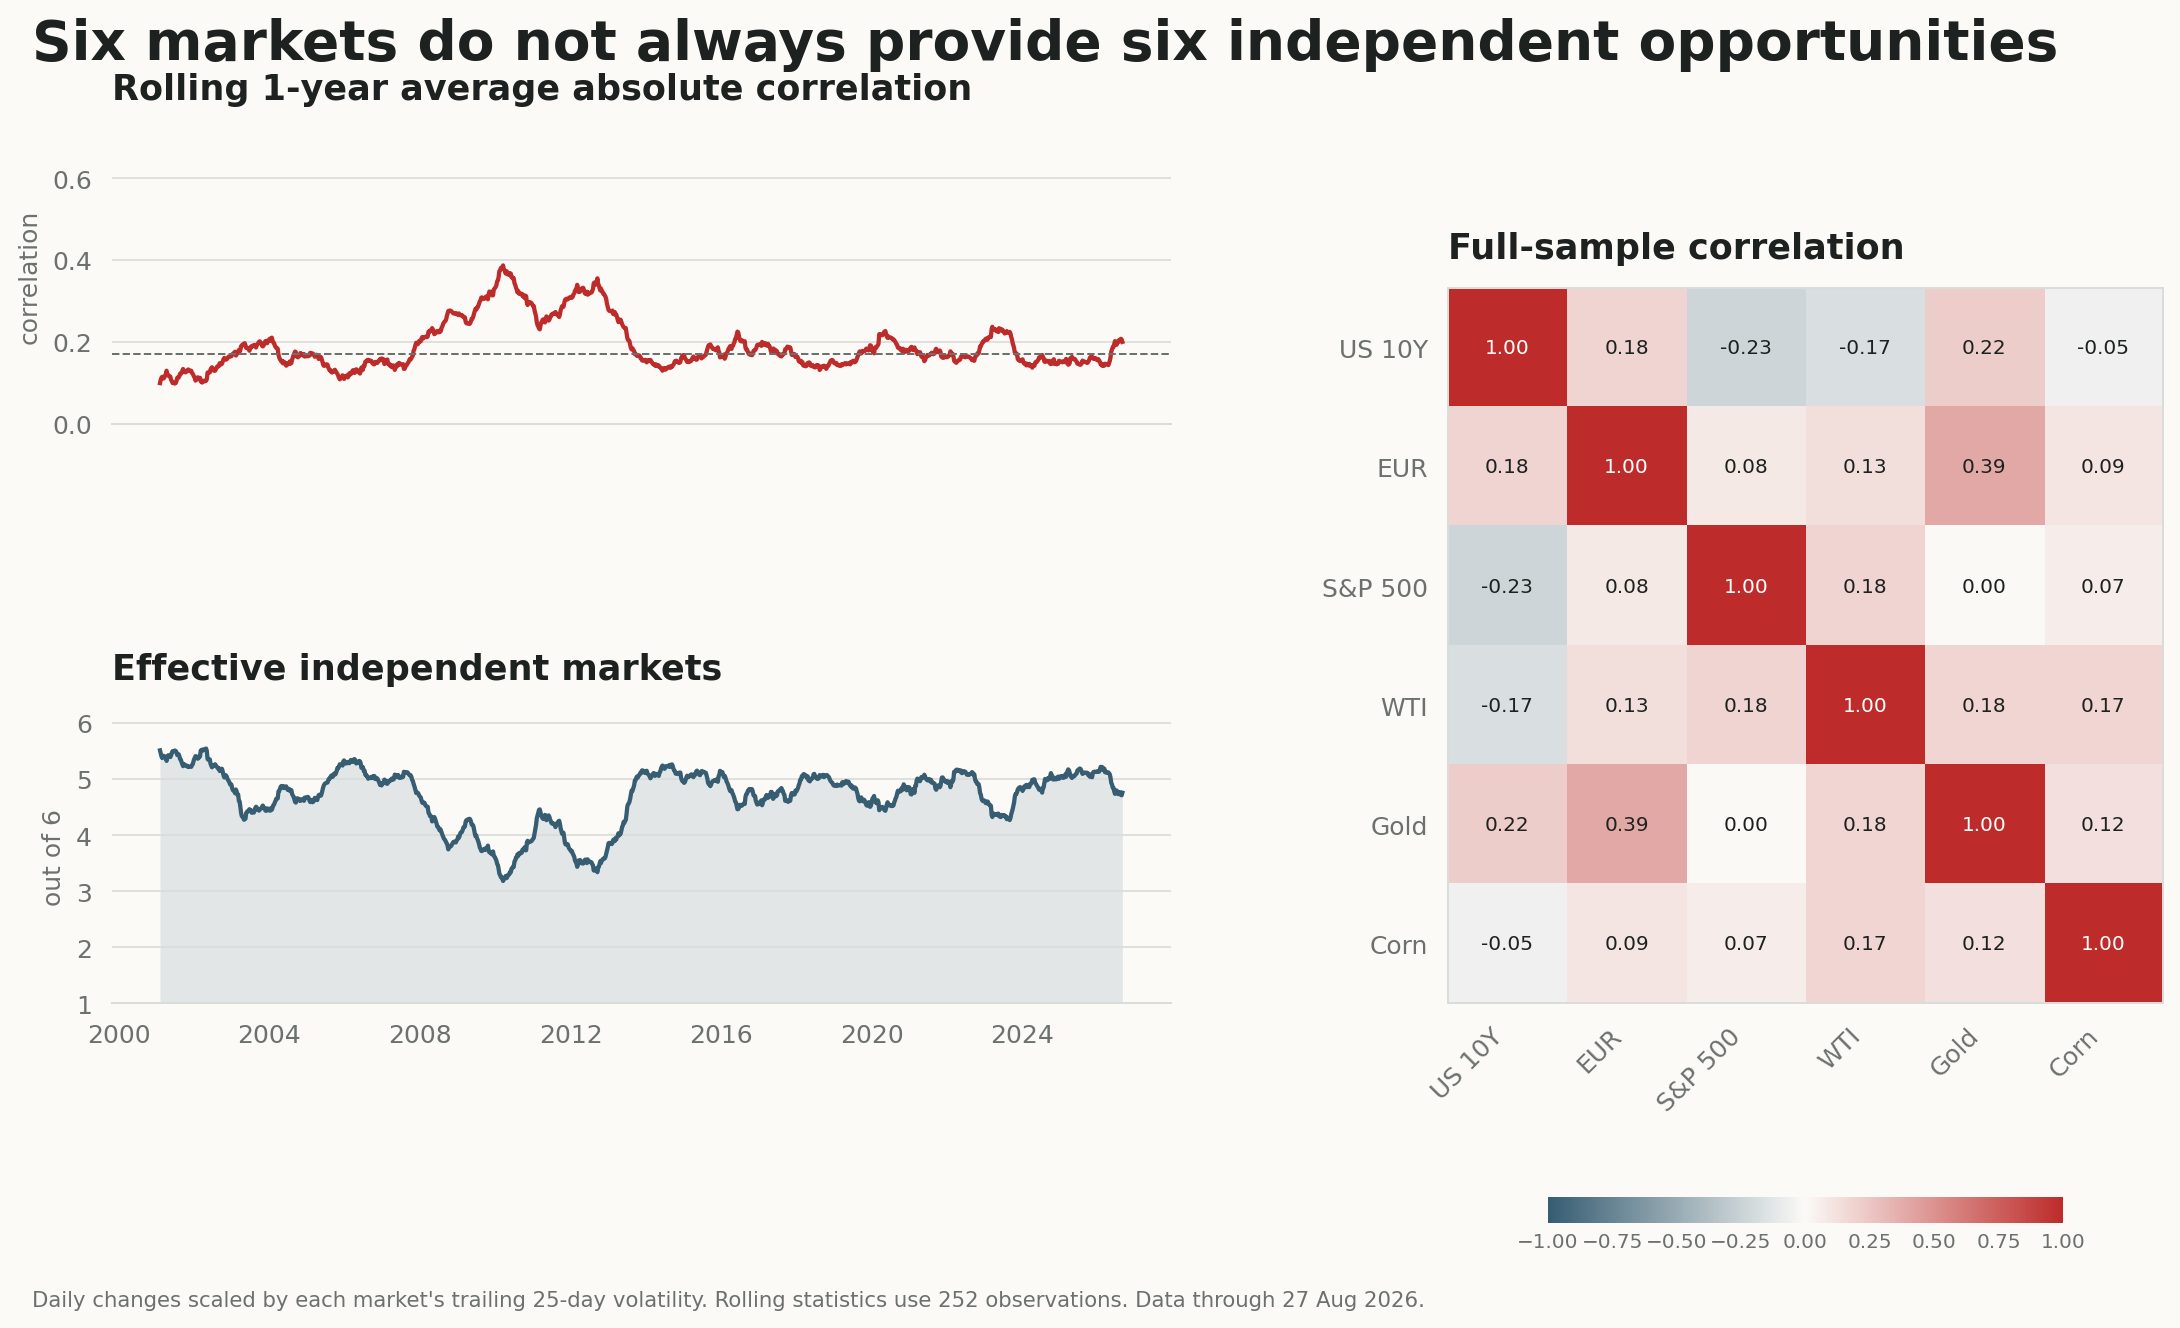
Six markets are not always six independent bets
A 26-year comparison of six futures markets shows why portfolio breadth must be measured through changing correlation, not counted in tickers.
 Read note →
Research notes
Empirical notes on futures data, portfolio construction, and systematic signals. Our notes set out the data, methods, and limitations behind each analysis.
Real market histories
Reproducible transformations
Scope and limitations
A 26-year comparison of six futures markets shows why portfolio breadth must be measured through changing correlation, not counted in tickers.
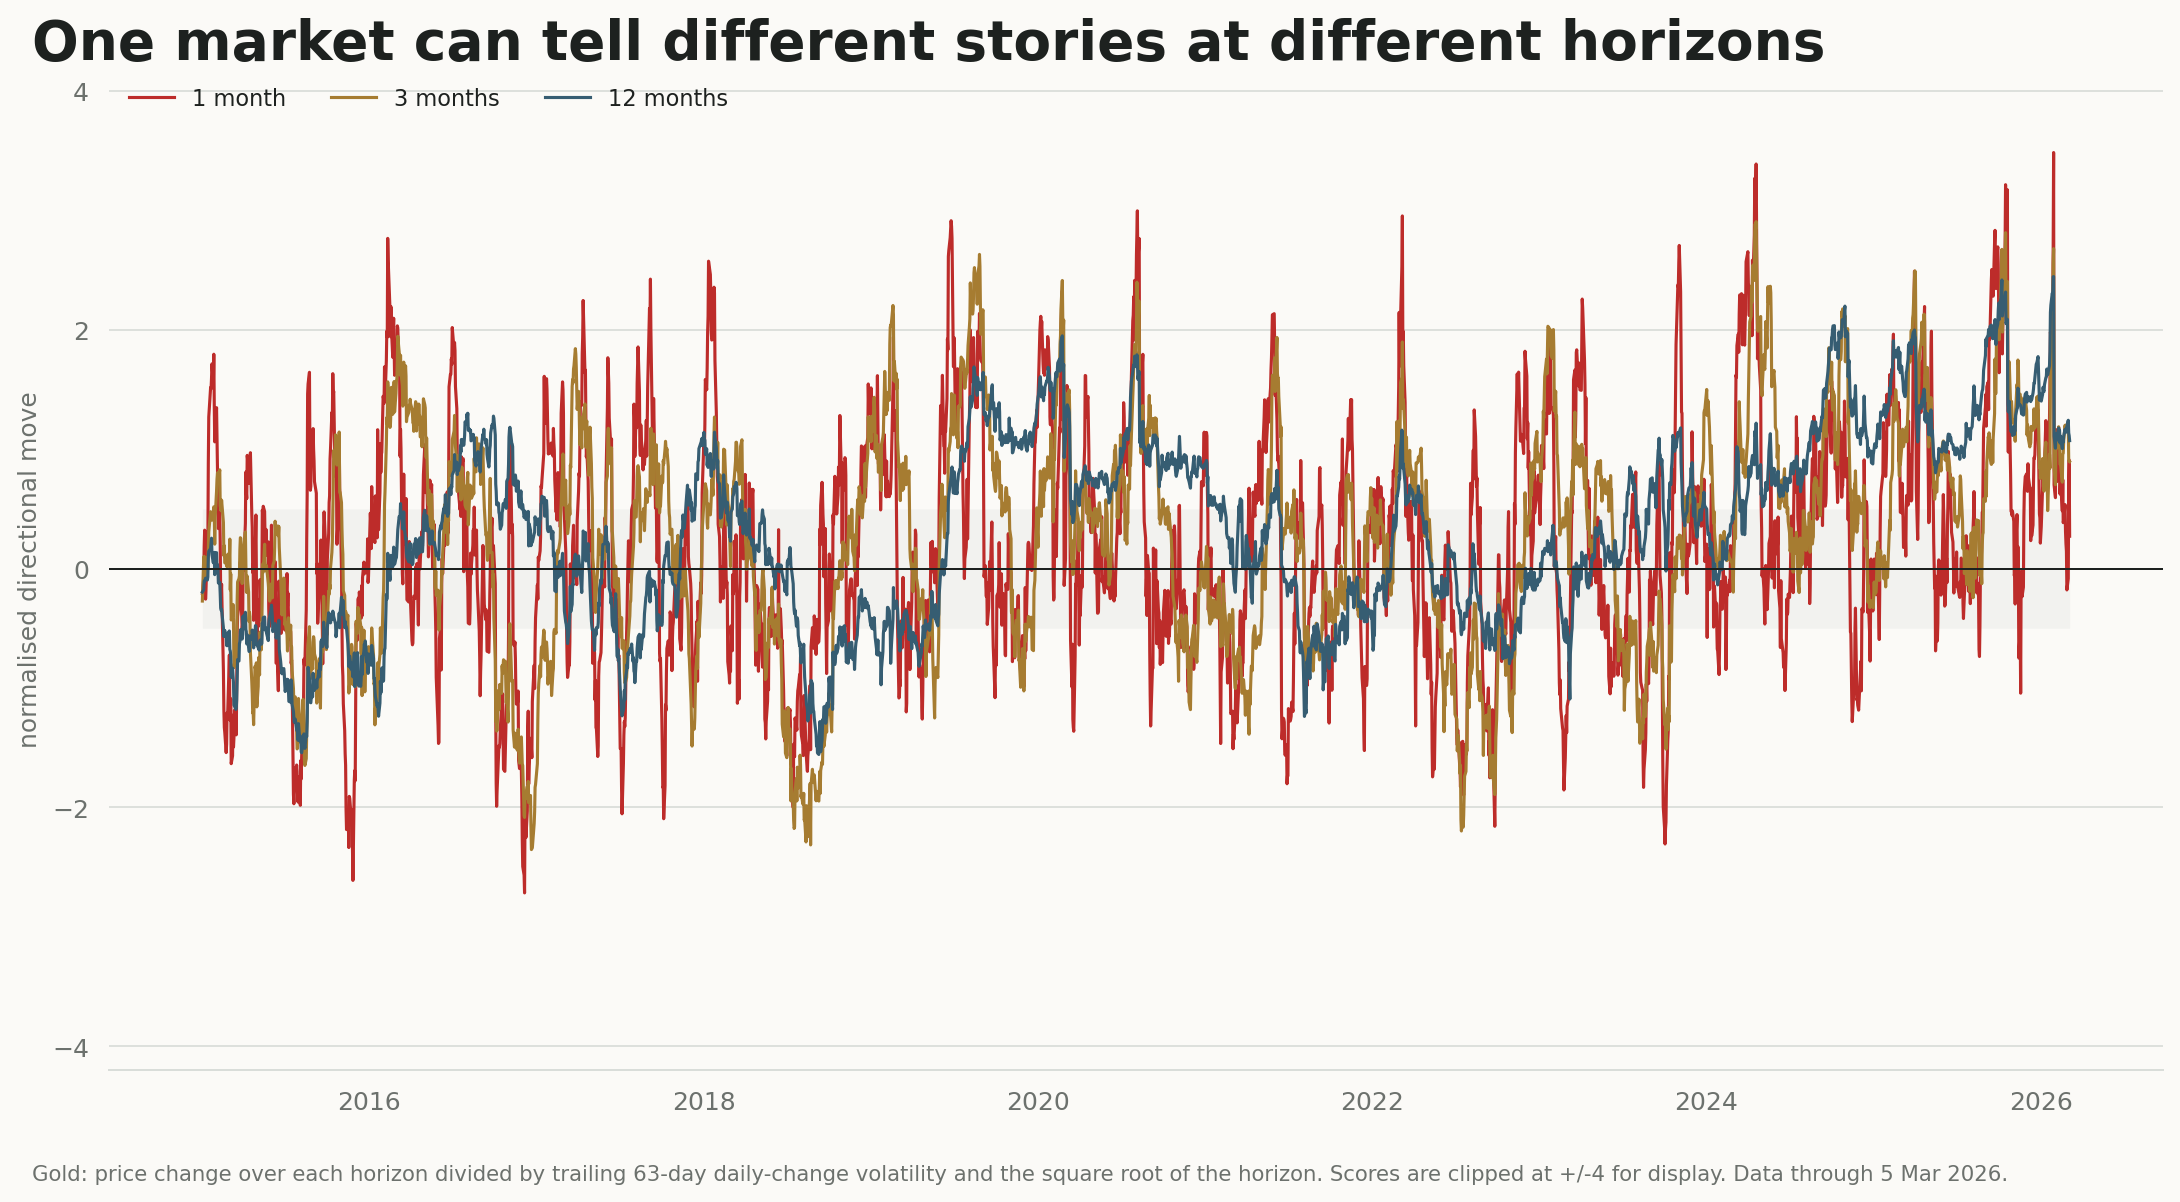
Read note →Gold moved in the same direction across one-, three-, and twelve-month windows on fewer than half the observations in this sample.
 Read note →
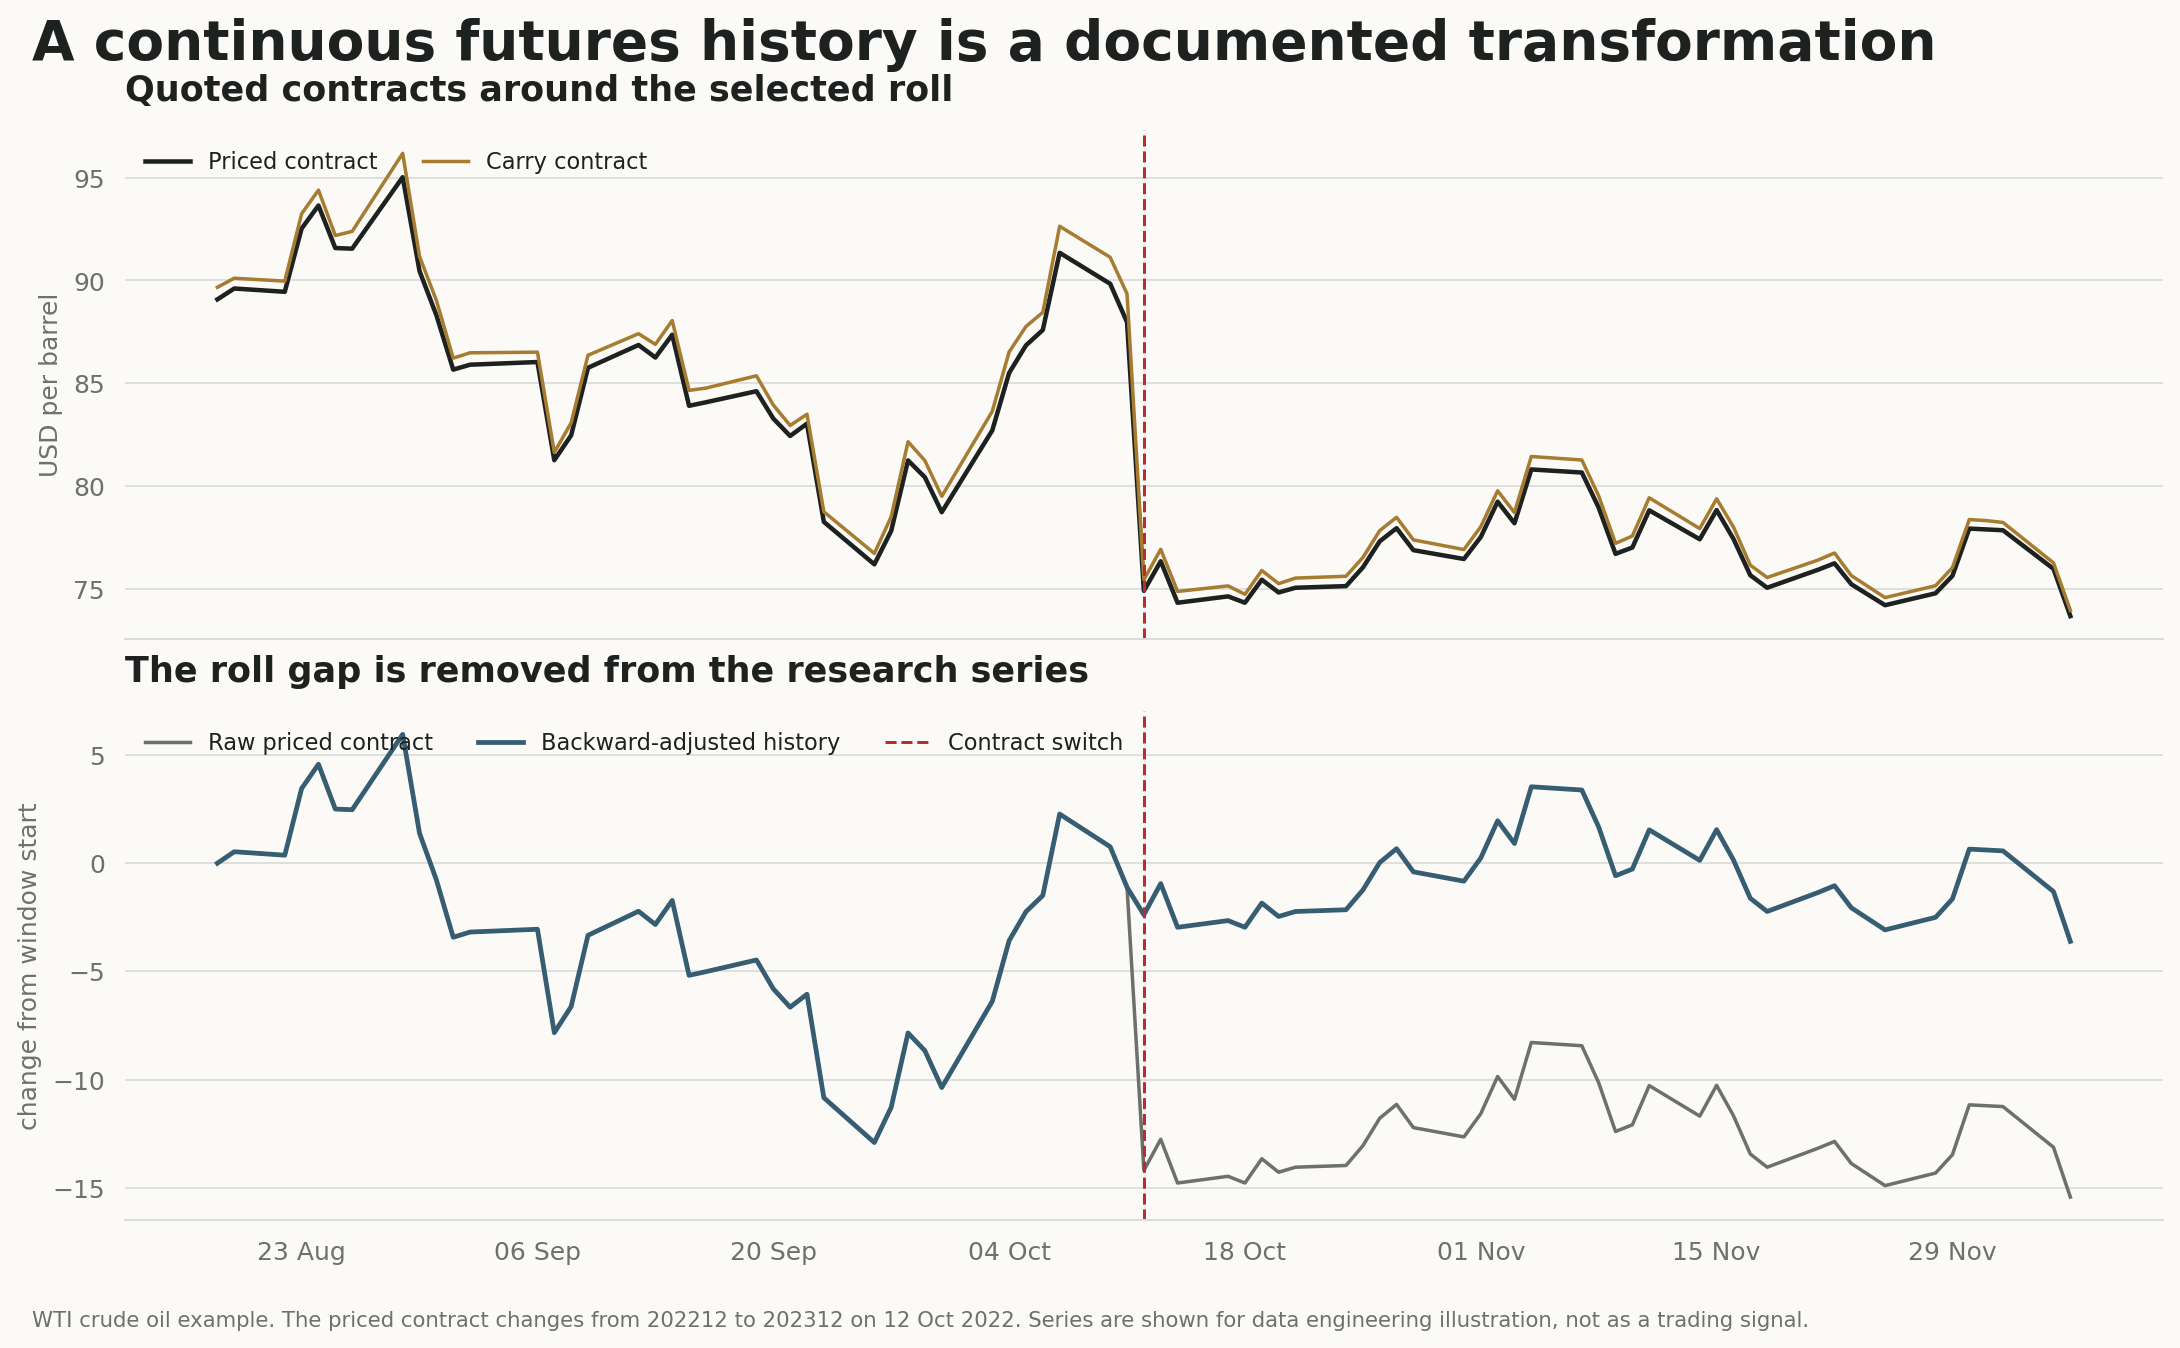
A WTI contract transition shows the artificial return created by stitching raw contracts—and the documented adjustment needed before research begins.
 Read note →
These notes explain research methods and market data. They are not investment advice, forecasts, or recommendations to trade any market.